There's a new feature in TRT Monitor: Saturation Tracking. It shows you how your testosterone levels fluctuate over time based on your actual doses and injection timing - not just a snapshot from a blood test, but a continuous estimate of what's happening in your system.
What is Saturation Tracking?
Saturation tracking models how your testosterone medication builds up and decays based on the doses you've logged and when you took them. A blood test only tells you what your levels were at one specific moment. This gives you the bigger picture.
It's particularly useful if you want to:
- See when your levels peak and dip so you can fine-tune injection timing
- Understand how different doses affect your levels over the following days
- Spot patterns that might explain why you feel great some days and flat on others
- Make protocol changes based on actual data rather than guesswork
![]()
How to Access Saturation Tracking
Head to your insights section and select "Saturation Tracking". The feature works with testosterone medications and uses your logged doses to calculate estimated saturation levels based on each compound's half-life.
How to Edit a Previous Medication to Add Tracking
If you've previously added testosterone all you need to do is:
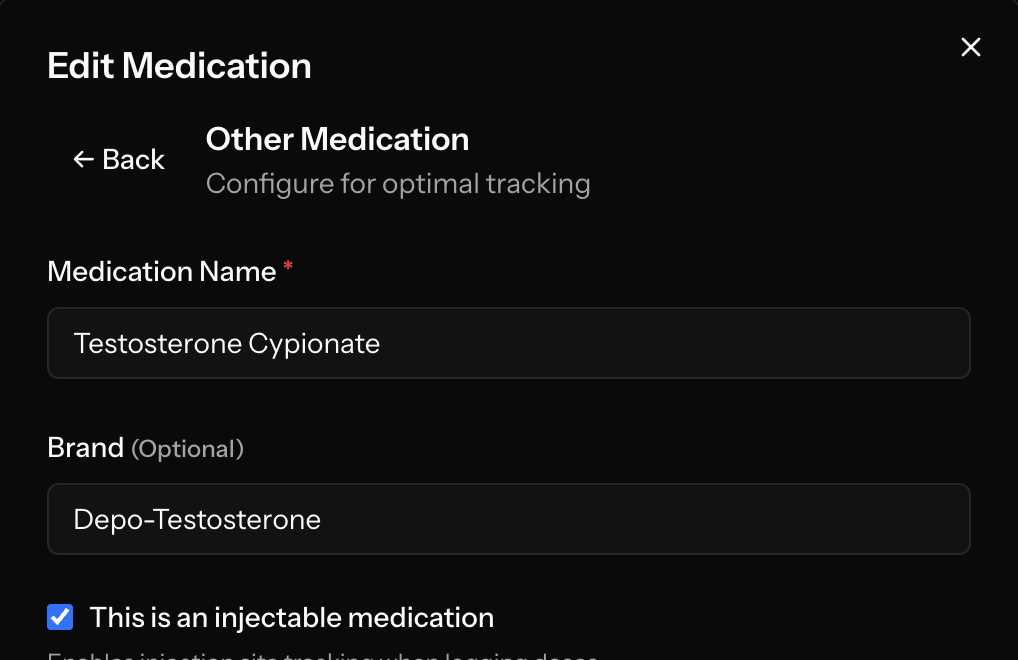
- Edit your medication
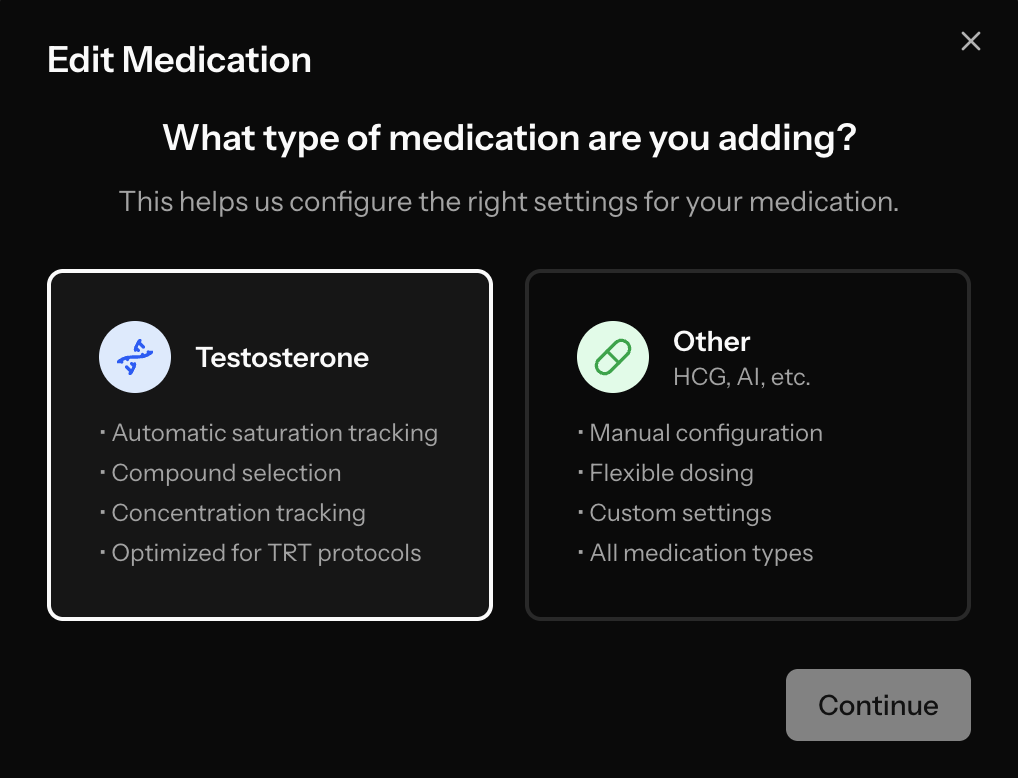
- Click the back button at the top left on the edit medication form
- Select Testosterone
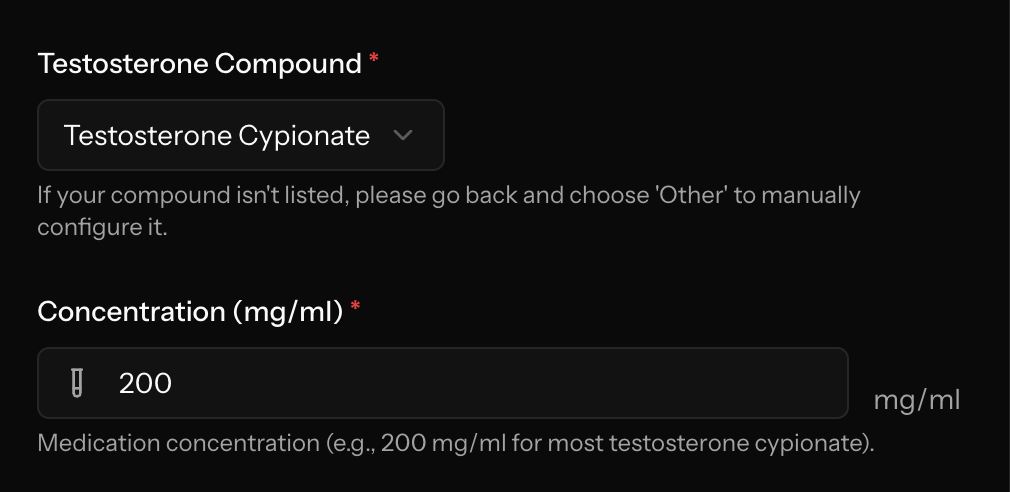
- Fill out the additional details
See the images below for a visual representation
Step 1:
Step 2:
Step 3:
Reading Your Saturation Chart
The chart shows a few things:
- Historical data (blue solid line) - how your levels have changed based on past doses
- Future projections (purple dashed line) - where your current levels are headed if you don't inject again
- Dose markers (green bars) - when and how much you injected
- Time ranges from 30 to 60 days for both historical and projected data
What You Can Do With It
Find Your Ideal Injection Frequency
A lot of guys struggle to nail down the right injection schedule. Saturation tracking shows you exactly when your levels start to drop off, which makes it much easier to figure out the right frequency for stable levels.
Connect Symptoms to Levels
If you're logging how you feel alongside your doses, you can overlay that with the saturation chart. Feeling tired or irritable on certain days? Check if it lines up with a trough in your levels.
Test Protocol Changes
Thinking about going from weekly to twice-weekly injections, or changing your dose? The saturation chart gives you a visual way to see how changes play out over time.
Bring Data to Your Doctor
Instead of trying to explain how you feel on different days, you can show your doctor a chart of your estimated hormone levels alongside your symptoms. It makes for a much more productive conversation.
Getting Started
You'll need three things:
- A testosterone medication added to your profile
- Logged doses to generate the saturation data
- Concentration information (mg/ml) for accurate calculations
The feature calculates saturation based on your medication's half-life and your actual injection timing, so the results are specific to your protocol.
What's Coming Next
Saturation tracking currently supports testosterone medications. We're planning to expand it to other compounds down the line.
Try It Out
Saturation tracking is available now for all TRT Monitor users. If you're not using TRT Monitor yet, sign up today and start building the data you need for better protocol decisions.
Got questions or feedback on saturation tracking? We'd like to hear from you.